> For the complete documentation index, see [llms.txt](https://nishanthkp.gitbook.io/tableu/llms.txt). Markdown versions of documentation pages are available by appending `.md` to page URLs; this page is available as [Markdown](https://nishanthkp.gitbook.io/tableu/chapter-4/row-level-calculations.md).
# Row-level calculations
We’ll walk through several examples of row-level calculations in this section. You’ll find the completed calculations in the `Complete` workbook, but you might prefer to start from scratch in the `Starter` workbook. We won’t necessarily cover creating a visualization for every example, but try building some of your own as you work through the examples.
## Concatenating strings
We’ll start with a very simple example and then build up in complexity. In the `Chapter 04` workbook, create a new calculated field called `Full Name` with the following code:
```markup
[First] + " " + [Last]
```
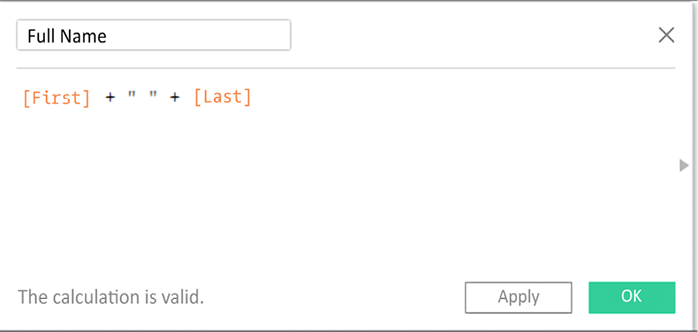
This code concatenates the strings of `First` and `Last` with a space in between them. Your calculation editor should look something like the following:
Figure 4.3: Creating the Full Name calculation in the editor
After clicking **OK**, you should notice a new **Full Name** field in the data pane. The value for that field is calculated per row of data. That is, every row of data contains the full name of the renter.
## String manipulation and conditional logic
Note that the `Rental Property` field contains values such as `112-Asbury Atoll` or `207-Beach Breeze`. Let’s assume that the naming convention of the rental unit in the vacation rental data gives us the room number and the name of the building separated by a dash. For example, the unit named `207-Beach Breeze` is room 207 of the Beach Breeze building.
Name the first `Room`, and add the following code:
```markup
SPLIT([Rental Property], "-", 1)
```
Then, create another calculated field named `Building` with the following code:
```markup
SPLIT([Rental Property], "-", 2)
```
Both of these functions use the `Split()` function, which splits a string into multiple values and keeps one of those values. This function takes three arguments: the **string**, the **delimiter** (a character or set of characters that separates values), and the **token number** (which value to keep from the split, that is, first, second, third, and so on). Using the `-` (dash) as the delimiter, `Room` is the first value and `Building` is the second.
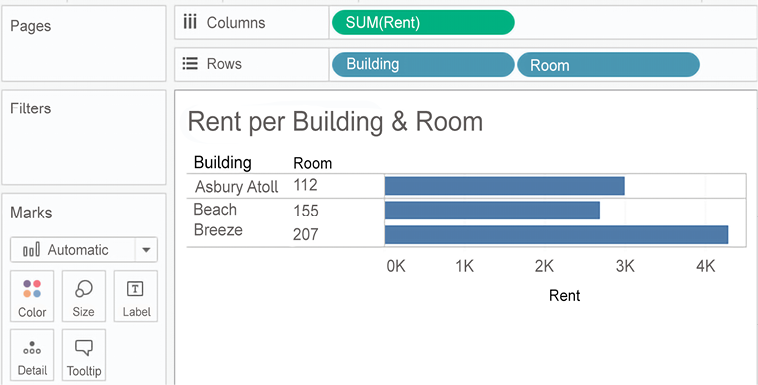
Using the two calculated fields, create a bar chart of **Rent per Building & Room**, like this:
Figure 4.4: Using your calculated fields to build a view
The **Building** and **Room** fields show up in the data pane as dimensions. The calculated dimensions can be used just like any other dimension. They can slice the data, define the level of detail, and group measures.
Row-level calculations are calculated at the row level, but you can choose to aggregate the results. For example, you could aggregate to find the highest **Room** number `(MAX)` or count the distinct number of **Buildings** `(COUNTD)`. In fact, if the result of a row-level calculation is numeric, Tableau will often place the resulting field as a measure by default. But as we’ve seen, you can use a row-level field as either a dimension or measure in the view.
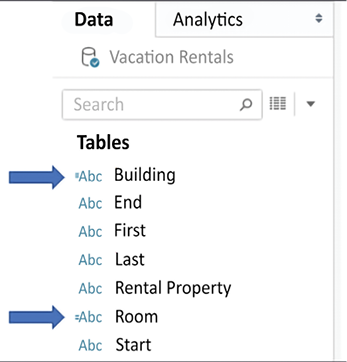
Note that Tableau adds a small equals sign to the icon of the fields in the data pane to indicate that they are calculated fields:
Figure 4.5: The small = sign indicates a field is a calculation
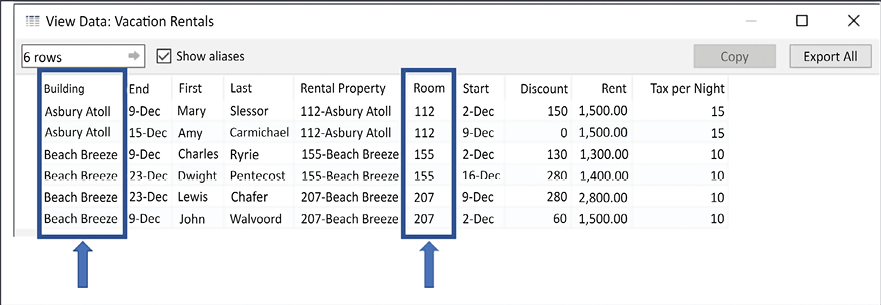
The code for both calculated fields is executed for every row of data and returns a row-level value. We can verify that the code is operating on the row level by examining the source data. Simply click on the **View Data** icon next to the dimensions to see the row-level detail (it’s next to the magnifying glass icon in the preceding screenshot). Here, the new fields of **Building** and **Unit**, along with the row-level values, can be clearly seen:
Figure 4.6: Viewing the underlying data shows us the calculation is done per row of data
Tableau provides a shortcut for splitting a field. You can use the drop-down menu on a field in the data pane and select **Transform** | **Split** or **Transform** | **Custom Split** (if you have a non-standard delimiter). The results are calculated fields similar to those you created previously, but with some additional logic around determining data types. Transform functionality, such as split, is also available for fields in the **Preview** or **Metadata** views on the **Data** source screen.
We’ll extend the example a bit more and assume you know that the floor of a room is indicated by its number. Rooms 100 through 199 are on the first floor, and 200 through 299 are on the second. You’d like to have that information available for analysis.
We could potentially add this attribute to the source data, but there are times when this may not be an option or may not be feasible. You may not have permission to change the source data or the source might be a spreadsheet that is automatically generated every day, and any changes would be overwritten.
Instead, you can create a row-level calculation in Tableau to extend the data. To do so, create a calculated field named `Floor` with the following code:
```markup
IF LEFT([Room], 1) = "1"
THEN "First Floor"
ELSEIF LEFT([Room], 1) = "2"
THEN "Second Floor"
END
```
This code uses the `LEFT()` function to return the leftmost character of the room. Thus, `112` gives a result of `1`; `207` gives a result of `2`.
The `IF THEN END` logic allows us to assign a result (either `First Floor` or `Second Floor`), depending on which case is true. Notice that you used the `Room` field in the calculation, which, in turn, was another calculation.
Using a reference to a calculated field within another calculation is referred to as **nesting.** The calculations that use other calculated fields are called **nested calculations**. There’s no theoretical limit to how many levels of nesting you can use, but it may become hard to untangle the logic if you use too many levels of nesting.
## Planning for data variations
As you write calculations, consider whether your calculation covers variations in the data that are not currently present.
A few good questions to ask yourself whenever you write a calculation in Tableau are: *What happens if the data changes?* *Does the calculation handle unexpected or invalid values?* *Have I covered every case?*
For example, the preceding floor calculation only works if all the rooms are either 100- or 200-level rooms. What if there is a room, 306, on the third floor, or a room, 822, on the eighth floor?
To account for additional cases, we might simplify our calculation to the following:
```markup
LEFT([Room], 1)
```
This code simply returns the leftmost character of the room number. We’ll get `3` for `306` and `8` for `822`. But what if we have room numbers such as 1056 on the tenth floor, and 1617 on the sixteenth? We’d have to consider other options, such as the following:
```markup
MID([Room], 0, LEN([Room]) - 2)
```
Although this is more complicated, the string functions return a substring that starts at the beginning of the string and ends just before the last two characters. That gives us floor `5` for `506`, and floor `18` for `1856`.
We’ve now considered some row-level calculation examples. Let’s move on to the next major type of calculation in Tableau: aggregate-level calculations.