# Density Maps Exercise 1
Density maps show the spread and concentration of values within a geographic area. Instead of individual points or symbols, the marks blend together, showing greater intensity in areas with a high concentration. You can control the **Color**, **Size**, and **Intensity**.
Let’s say you want to understand the geographic concentration of orders. You might create a density map using the following steps:
1. Navigate to the **Density of Orders** sheet.
2. Double-click on the `Postal Code` field in the **Data** pane. Just as before, Tableau automatically creates a symbol map geographic visualization using the `Latitude (generated)`, `Longitude (generated)`, and `State` fields.
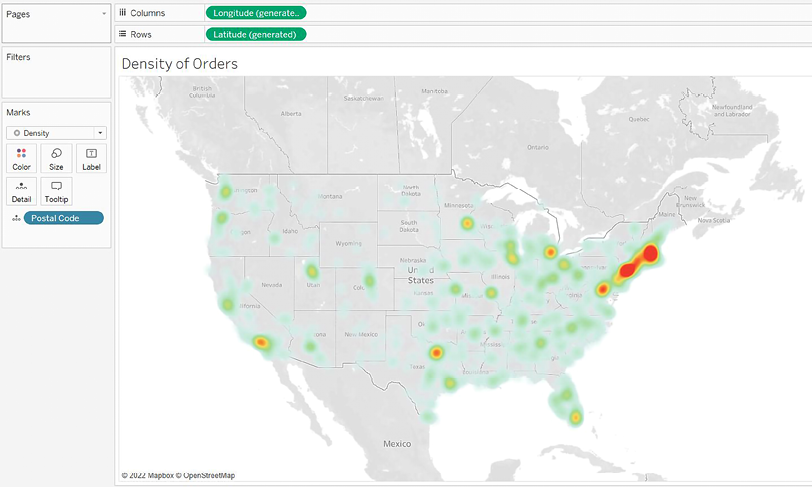
3. Using the drop-down menu on the **Marks** card, change the mark type to **Density**. The individual circles now blend together showing concentrations:
Figure 1.23: A density map showing concentration by postal code
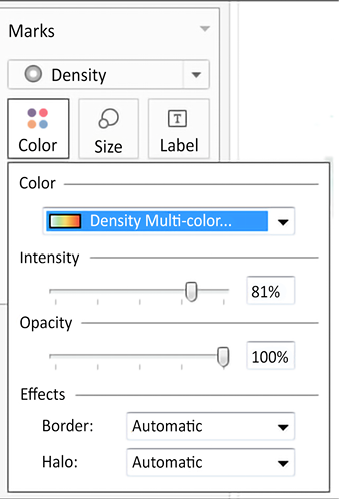
Try experimenting with the **Color** and **Size** options. Clicking on **Color**, for example, reveals some options specific to the **Density** mark type:
Figure 1.24: Options for adjusting the Color, Intensity, Opacity, and Effects for Density marks
Several color palettes are available that work well for density marks (the default ones work well with light color backgrounds, but there are others designed to work with dark color backgrounds). The **Intensity** slider allows you to determine how intensely the marks should be drawn based on concentrations. The **Opacity** slider lets you decide how transparent the marks should be.
---
# Agent Instructions: Querying This Documentation
If you need additional information that is not directly available in this page, you can query the documentation dynamically by asking a question.
Perform an HTTP GET request on the current page URL with the `ask` query parameter:
```
GET https://nishanthkp.gitbook.io/tableu/chapter-1/density-maps-exercise-1.md?ask=
```
The question should be specific, self-contained, and written in natural language.
The response will contain a direct answer to the question and relevant excerpts and sources from the documentation.
Use this mechanism when the answer is not explicitly present in the current page, you need clarification or additional context, or you want to retrieve related documentation sections.