# Tableau Paradigm Exercise 1
### The Tableau paradigm in action
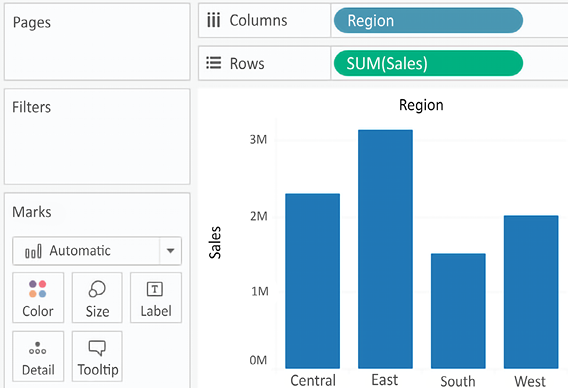
Open the `Chapter 02 Starter.twbx` workbook located in the `\Learning Tableau\Chapter 02` directory and navigate to the `Tableau Paradigm` sheet. That view was created by dropping the **Region** dimension on **Columns** and the **Sales** measure on **Rows**. Here is a screenshot:
Figure 2.2: This bar chart is the result of a query that returned four aggregate rows of data
The view is defined by two fields. **Region** is the only dimension, which means it defines the level of detail in the view and slices the measure so that there will be a bar per region. **Sales** is used as a measure aggregated by summing each sale within each region. (Notice also that **Region** is discrete, resulting in column headers, while **Sales** is continuous, resulting in an axis.)
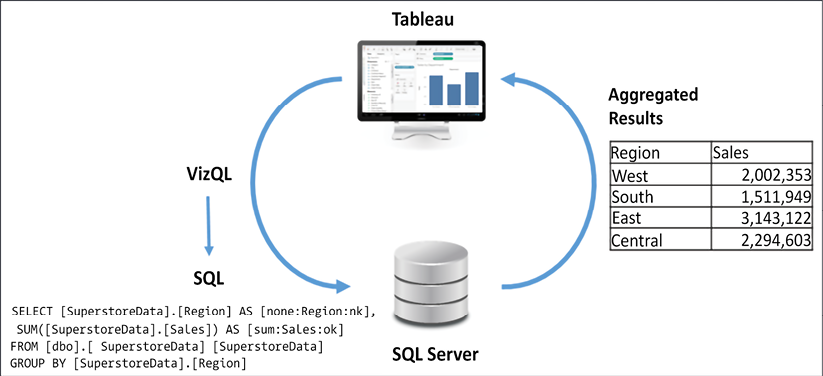
For the purpose of this example (although the principle is applicable to any data source), let’s say you were connected live to a SQL Server database with the `Superstore` data stored in a table. When you first create the preceding screenshot, Tableau generates a VizQL script, which is translated into a SQL script and sent to the SQL Server. The SQL Server database engine evaluates the query and returns aggregated results to Tableau, which are then rendered visually.
The entire process would look something like the following diagram in Tableau’s paradigm:
Figure 2.3: Tableau generated the bar chart in the previous image using a paradigm like this
There may have been hundreds, thousands, or even millions of rows of sales data in SQL Server. However, when SQL Server processes the query, it returns aggregate results. In this case, SQL Server returns only four aggregate rows of data to Tableau—one row for each region.
On occasion, a database administrator may want to find out what scripts are running against a certain database to debug performance issues or to determine more efficient indexing or data structures. Many databases supply profiling utilities or log execution of queries. In addition, you can find SQL or MDX generated by Tableau in the logs located in the `My Tableau Repository\Logs` directory.
You may also use Tableau’s built-in **Performance Recorder** to locate the queries that have been executed. From the top menu, select **Help** | **Settings and Performance** | **Start Performance Recording**, then interact with a view, and finally, stop the recording from the menu. Tableau will open a dashboard that will allow you to see tasks, performance, and queries that were executed during the recording session.
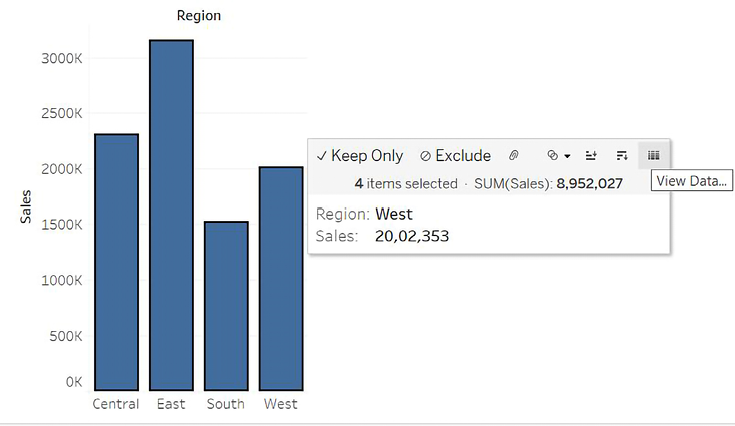
To see the aggregate data that Tableau used to draw the view, press *Ctrl* + *A* to select all the bars, and then right-click one of them and select **View Data…**:
Figure 2.4: Use the View Data… tooltip option to see a summary or underlying data for a mark
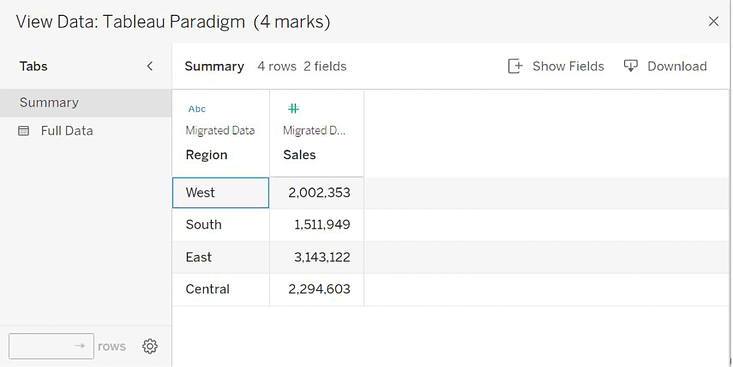
This will reveal a **View Data** window:
Figure 2.5: The Summary tab displays the aggregate data Tableau used to render each mark in the view
The **View Data** screen allows you to observe the data in the view. The **Summary** tab displays the aggregate-level data that was used to render the view. The **Sales** values here are the sum of sales for each region. When you click the **Full Data** tab, Tableau will query the data source to retrieve all the records that make up the aggregate records.
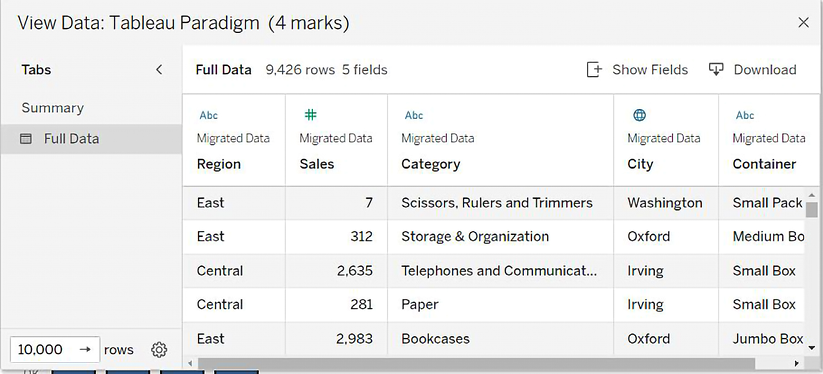
In this case, there are **9,426** underlying records, as indicated on the status bar in the following screenshot:
Figure 2.6: The Full Data tab reveals the row-level data in the database
Tableau did not need **9,426** records to draw the view and did not request them from the data source until the **Full Data** tab was clicked.