> For the complete documentation index, see [llms.txt](https://nishanthkp.gitbook.io/tableu/llms.txt). Markdown versions of documentation pages are available by appending `.md` to page URLs; this page is available as [Markdown](https://nishanthkp.gitbook.io/tableu/chapter-1/tablue-interface-overview.md).
# Tablue Interface Overview
* Open Tableau. You should see the home screen with a list of connection options on the left and, if applicable, thumbnail previews of recently edited workbooks in the center, along with sample workbooks at the bottom.
* Under **Connect** and **To a File**, click on **Text File**.
* In the **Open** dialog box, navigate to the `\Learning Tableau\Chapter 01` directory and select the `Superstore.csv` file.
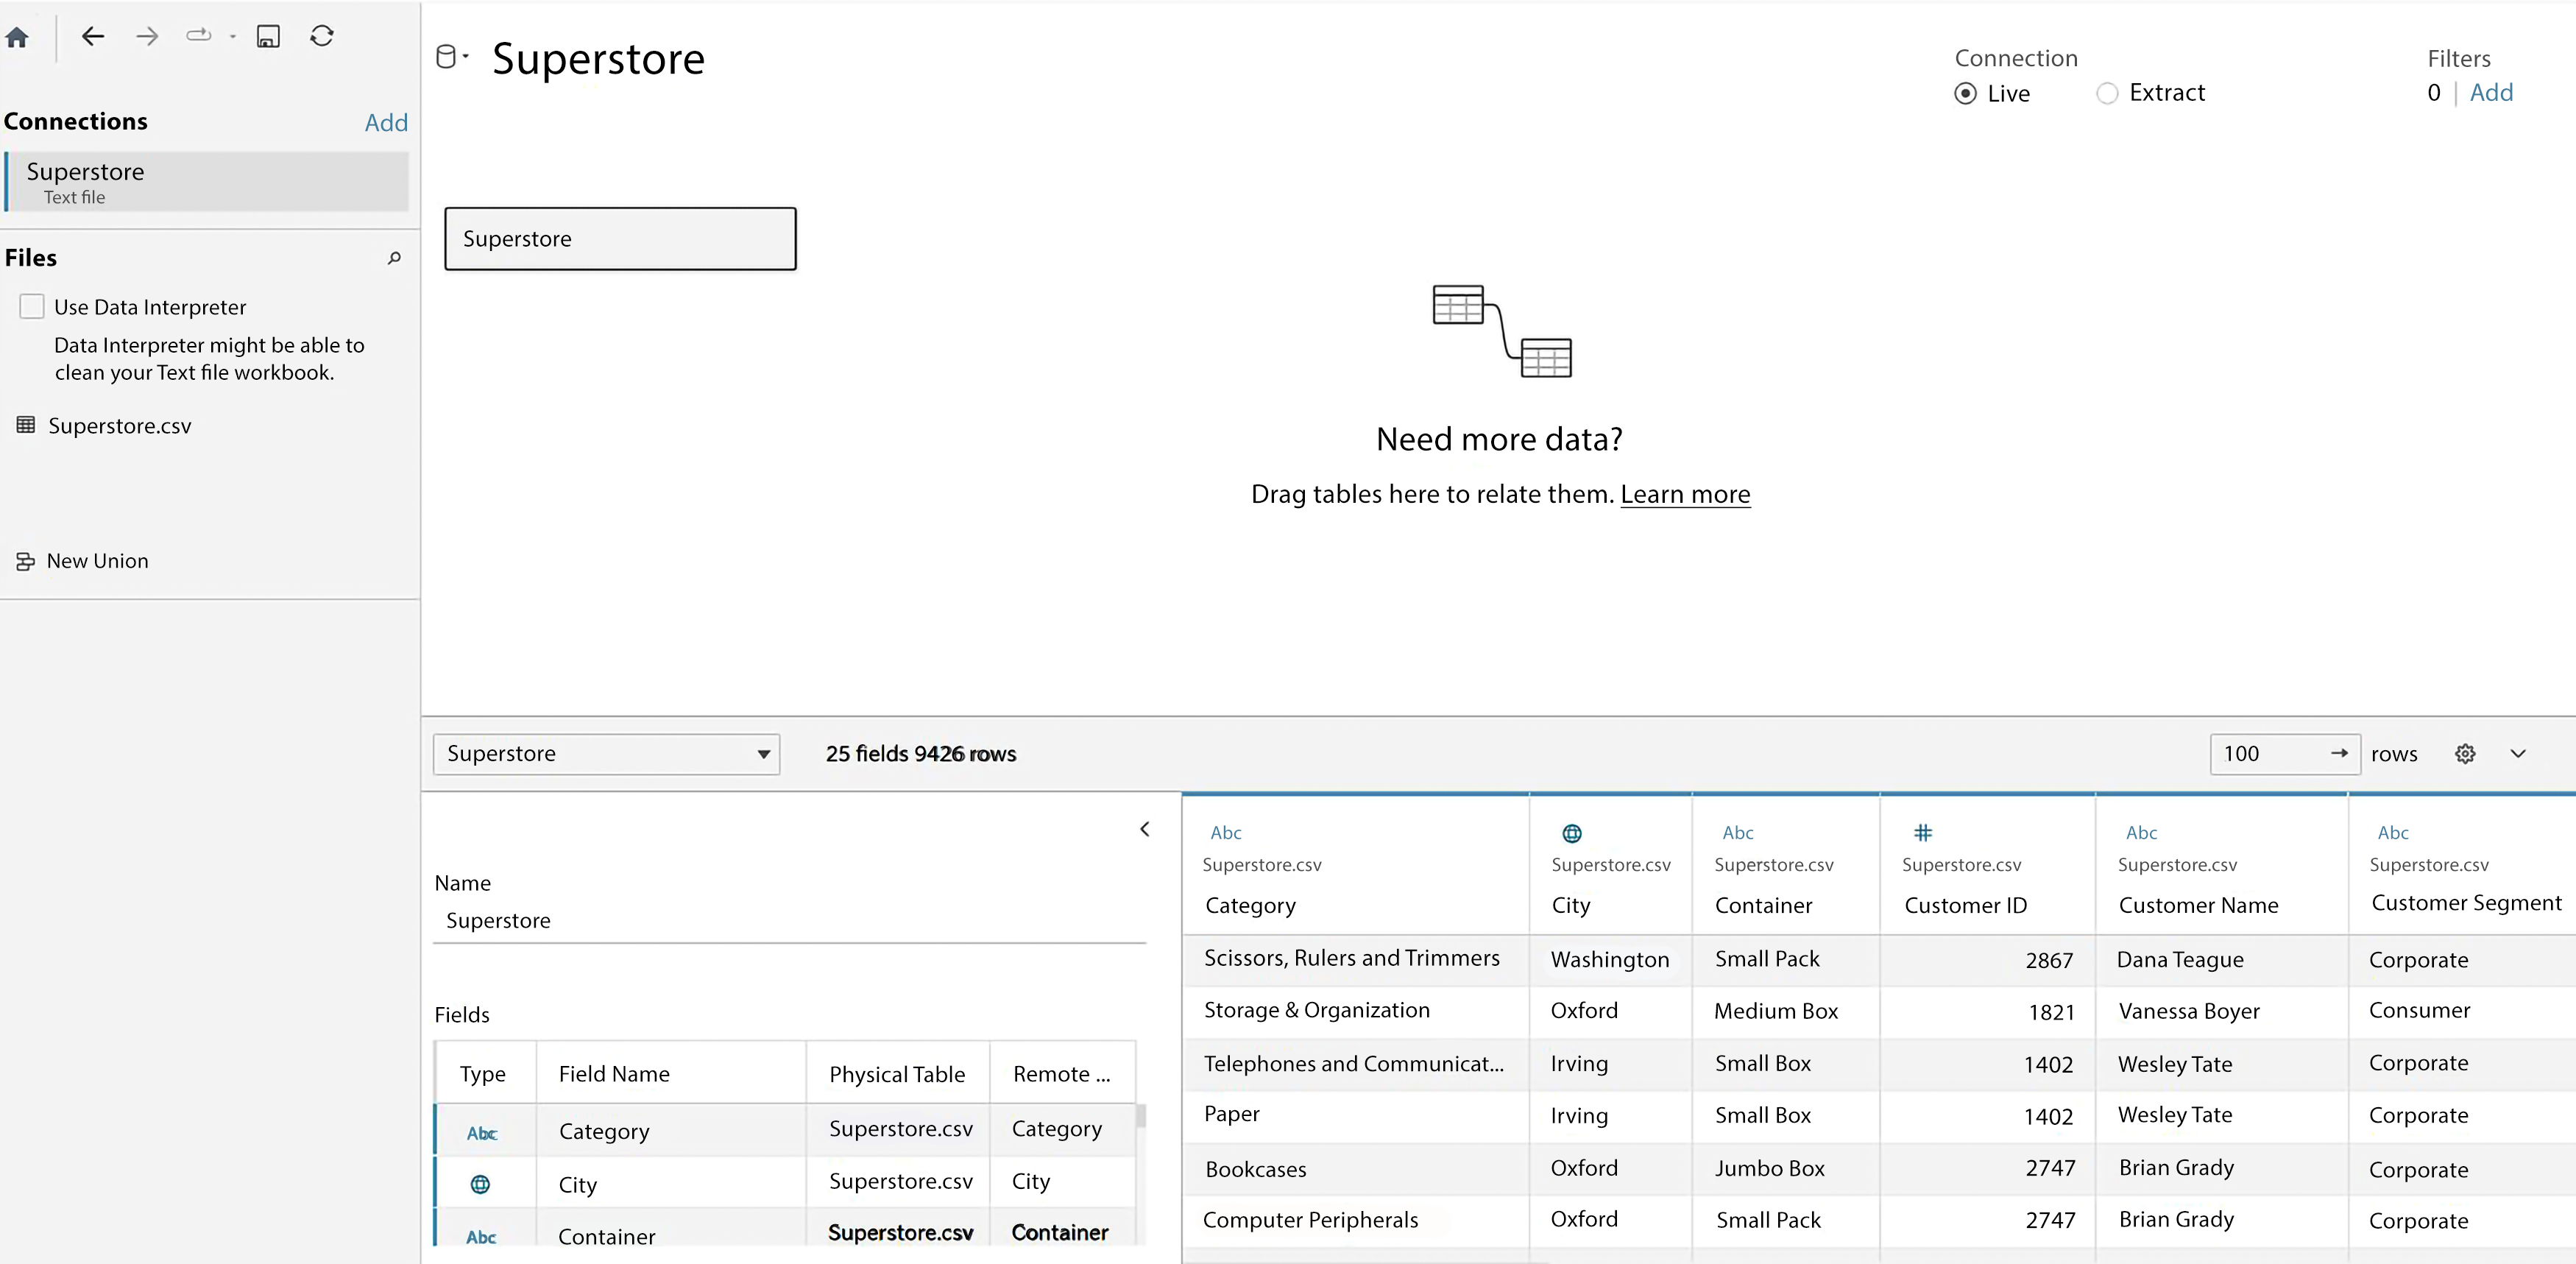
You will now see the data connection screen, which allows you to visually create connections to data sources. We’ll examine the features of this screen in detail in the *Connecting to data* section of *Chapter 2*, *Connecting to Data in Tableau*. For now, Tableau has already added a preview of the file for the connection:
Figure 1.1: The data connection screen allows you to build a connection to your data
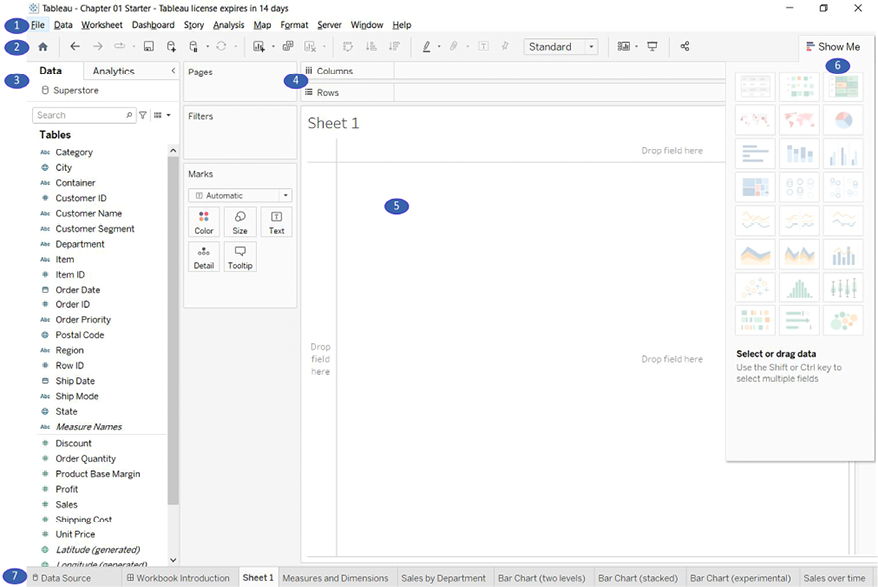
For this connection, no other configuration is required, so simply click on the **Sheet 1** tab at the bottom of the Tableau window to start visualizing the data! You should now see the main work area within Tableau, which looks like this:
Figure 1.2: Elements of Tableau’s primary interface, numbered with descriptions below
We’ll refer to elements of the interface throughout the book using specific terminology, so take a moment to familiarize yourself with the terms used for various components numbered in the preceding screenshot:
1. The **menu** contains various menu items for performing a wide range of functions.
2. The **toolbar** allows common functions such as undo, redo, save, add a data source, and so on.
3. The **Data** pane is active when the **Data** tab is selected and lists all tables and fields of the selected data source. The **Analytics** pane is active when the **Analytics** tab is selected and gives options for supplementing visualizations with visual analytics.
4. Various shelves such as **Pages**, **Columns**, **Rows**, and **Filters** serve as areas to drag and drop fields from the data pane. The **Marks** card contains additional shelves such as **Color**, **Size**, **Text**, **Detail**, and **Tooltip**. Tableau will visualize data based on the fields you drop onto the shelves.
Data fields in the **Data** pane are available to add to a view. Fields that have been dropped onto a shelf are called *in the view* or *active fields* because they play an active role in the way Tableau draws the visualization.
5. The **canvas** or **view** is where Tableau will draw the data visualization. In addition to dropping fields on shelves, you may also drop fields directly onto the view. A **title** is located at the top of the canvas. By default, the title displays the name of the sheet, but it can be edited or hidden.
6. **Show Me** is a feature that allows you to quickly iterate through various types of visualizations based on data fields of interest. We’ll look at **Show Me** in the *Using Show Me* section.
7. The tabs at the bottom of the window give you options for editing the data source, as well as navigating between and adding any number of sheets, dashboards, or stories. Often, any tab (whether it is a sheet, a dashboard, or a story) is referred to generically as a **sheet**.