Discrete and continuous fields
Another important distinction to make with fields is whether a field is being used as discrete or continuous. Whether a field is discrete or continuous determines how Tableau visualizes it based on where it is used in the view. Tableau will give a visual indication of the default value for a field (the color of the icon in the Data pane) and how it is being used in the view (the color of the active field on a shelf). Discrete fields, such as Region in the previous example, are blue. Continuous fields, such as Sales, are green.
Discrete fields
Discrete (blue) fields have values that are shown as distinct and separate from one another. Discrete values can be reordered and still make sense. For example, you could easily rearrange the values of Region to be East, South, West, and Central, instead of the default order in Figure 1.4.
When a discrete field is used on the Rows or Columns shelves, the field defines headers. Here, the discrete field Region defines the column headers:

Figure 1.5: The discrete field on Columns defines column headers
Here, it defines the row headers:
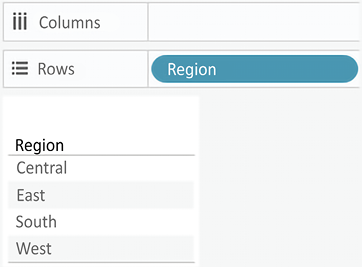
Figure 1.6: The discrete field on Rows defines row headers
When used for Color, a discrete field defines a discrete color palette in which each color aligns with a distinct value of the field:

Figure 1.7: The discrete field on Color defines a discrete color palette
Continuous fields
Continuous (green) fields have values that flow from first to last as a continuum. Numeric and date fields are often (though, not always) used as continuous fields in the view. The values of these fields have an order that it would make little sense to change.
When used on Rows or Columns, a continuous field defines an axis:

Figure 1.8: The continuous field on Columns (or Rows) defines an axis
When used for Color, a continuous field defines a gradient:

Figure 1.9: The continuous field on Color defines a gradient color palette
It is very important to note that continuous and discrete are different concepts from measure and dimension. While most dimensions are discrete by default, and most measures are continuous by default, it is possible to use any measure as a discrete field and some dimensions as continuous fields in the view, as shown here:

Figure 1.10: Measures and dimensions can be discrete or continuous
In general, you can think of the differences between the types of fields as follows:
Choosing between a dimension and measure tells Tableau how to slice or aggregate the data.
Choosing between discrete and continuous tells Tableau how to display the data with a header or an axis and defines individual colors or a gradient.
Last updated