# Measures and Dimensions
The fields from the data source are visible in the **Data** pane and are divided into **Measures** and **Dimensions.**
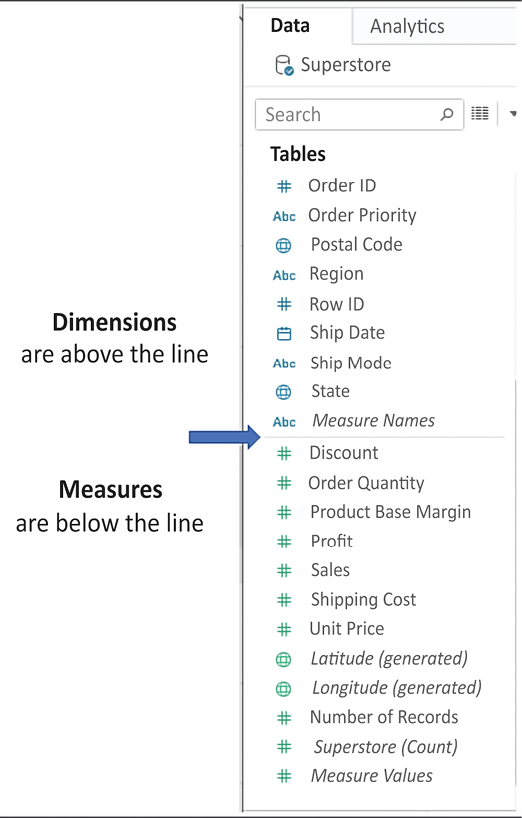
Prior to Tableau 2020.2, these are separate sections in the **Data** pane. In newer versions, each table will have **Measures** and **Dimensions** separated by a line:
Figure 1.3: Each table (this data source only has one) has dimensions listed above the line and measures listed below the line
The difference between **Measures** and **Dimensions** is a fundamental concept to understand when using Tableau:
* **Measures** are values that are aggregated. For example, they are summed, averaged, or counted, or the result is the minimum or maximum value.
* **Dimensions** are values that determine the level of detail at which measures are aggregated. You can think of them as slicing the measures or creating groups into which the measures fit. The combination of dimensions used in the view defines the view’s basic level of detail.
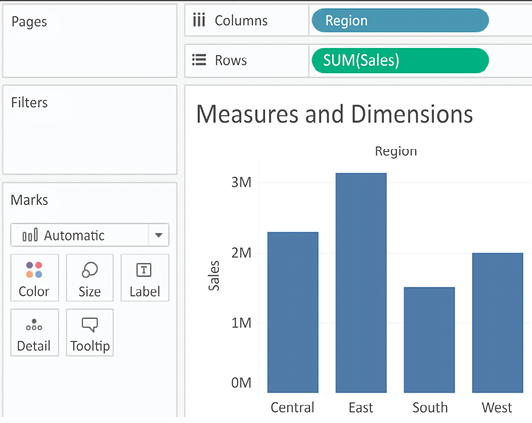
As an example (which you can view in the `Chapter 01 Starter` workbook on the **Measures and Dimensions** sheet), consider a view created using the `Region` and `Sales` fields from the `Superstore` connection:
Figure 1.4: A bar chart demonstrating the use of Measures and Dimensions
The `Sales` field is used as a measure in this view. Specifically, it is being aggregated as a sum. When you use a field as a measure in the view, the type aggregation (for example, `SUM`, `MIN`, `MAX`, and `AVG`) will be shown on the active field. Note that, in the preceding example, the active field on **Rows** clearly indicates the sum aggregation of `Sales`: **SUM(Sales)**.
The `Region` field is a dimension with one of four values for each record of data: **Central**, **East**, **South**, or **West**. When the field is used as a dimension in the view, it slices the measure. So, instead of an overall sum of sales, the preceding view shows the sum of sales for each region.
---
# Agent Instructions: Querying This Documentation
If you need additional information that is not directly available in this page, you can query the documentation dynamically by asking a question.
Perform an HTTP GET request on the current page URL with the `ask` query parameter:
```
GET https://nishanthkp.gitbook.io/tableu/chapter-1/measures-and-dimensions.md?ask=
```
The question should be specific, self-contained, and written in natural language.
The response will contain a direct answer to the question and relevant excerpts and sources from the documentation.
Use this mechanism when the answer is not explicitly present in the current page, you need clarification or additional context, or you want to retrieve related documentation sections.