> For the complete documentation index, see [llms.txt](https://nishanthkp.gitbook.io/tableu/llms.txt). Markdown versions of documentation pages are available by appending `.md` to page URLs; this page is available as [Markdown](https://nishanthkp.gitbook.io/tableu/chapter-3/date-parts-date-values-and-exact-dates.md).
# Date parts, date values, and exact dates
Navigate to the `Built-in Date Hierarchy` sheet, and create a view by dragging and dropping **Number of Patient Visits** to **Rows** and **Date of Admit** to **Columns**. The **YEAR(Date of Admit)** field on **Columns** will have a plus sign indicator, like this:
Figure 3.20: The field representing the Year part of the date hierarchy
You’ll also find a plus or minus indicator as you hover over headers, like this:
Figure 3.21: A plus icon on the column headers that could be used to expand the hierarchy
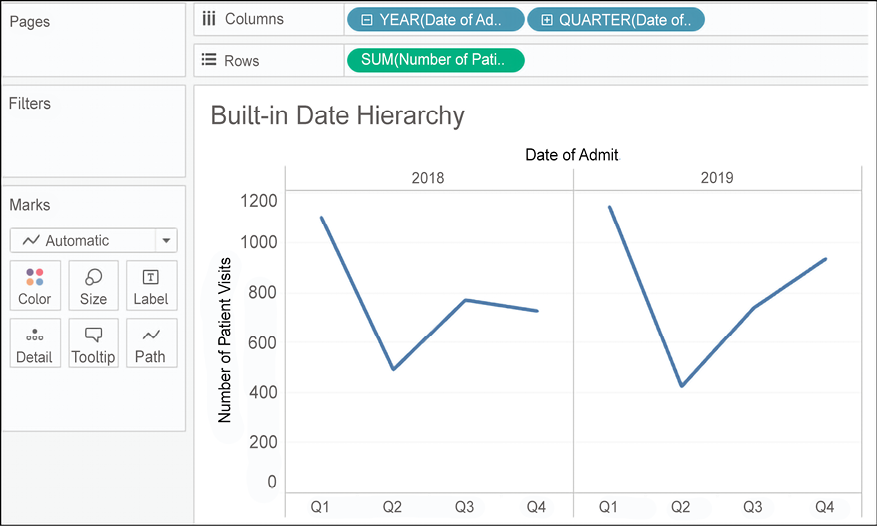
When you click it, the hierarchy expands by adding **QUARTER(Date of Admit)** to the right of **YEAR(Date of Admit)** on **Columns**, and the view is expanded to the new level of the hierarchy:
Figure 3.22: The expanded hierarchy with the year and quarter shown
The **YEAR(Date of Admit)** field now has a minus sign indicator that allows you to collapse the hierarchy back to the year level. The **QUARTER** field also has a plus sign, indicating that you can expand the hierarchy further. Starting with **Year**, the hierarchy flows as follows: **Year** | **Quarter** | **Month** | **Day**. When the field is a date and time, you can further drill down into **Hour** | **Minute** | **Second**. Any of the parts of the hierarchy can be moved within the view or removed from the view completely.
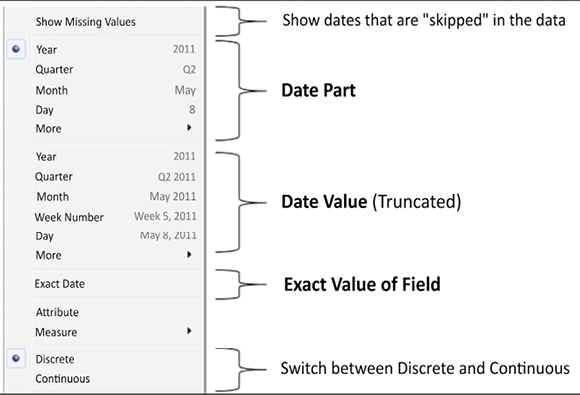
The hierarchy is made up of **Date Parts**, which is one of the three ways a date field can be used. When you right-click the date field in the view or by using the drop-down menu, you’ll see multiple date options, as follows:
Figure 3.23: The drop-down menu on an active date field demonstrates the various aspects of dates in Tableau
The three major date types are evident, though not explicitly labeled, in the menu:
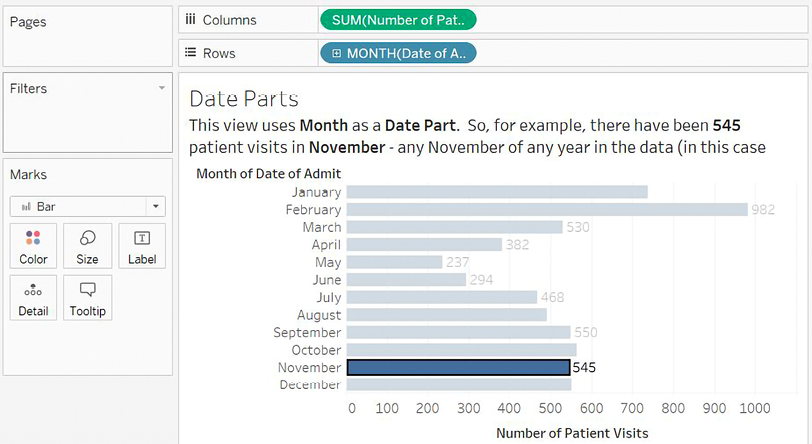
* **Date part**: This field will represent a specific part of the date, such as the quarter or month. The part of the date is used by itself and without reference to any other part of the date. This means that the date of November 8, 1980, when used as a month date part, is simply **November** in the view. The **November** that’s selected in the view here represents all of the Novembers in the dataset, while the number of patient visits is the total for both 2018 and 2019:
Figure 3.24: This view uses Month as a date part. The number of patient visits is the total for the month, without regard to the year
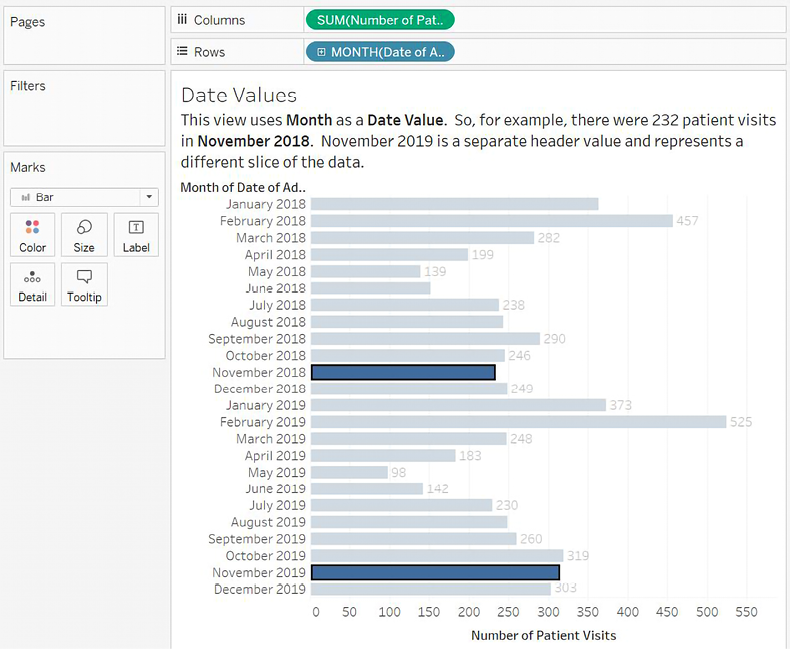
* **Date value**: This field will represent a date value, but rolled up or truncated to the level you select. For example, if you select a date value of **Month**, then November 8, 2019, gets truncated to the month and year and is **November 2019**. You’ll notice that **November 2018** and **November 2019** each have a separate value in the header and a distinct bar:
Figure 3.25: This view uses Month as a date value. The number of patient visits is the total for the month with regard to the year